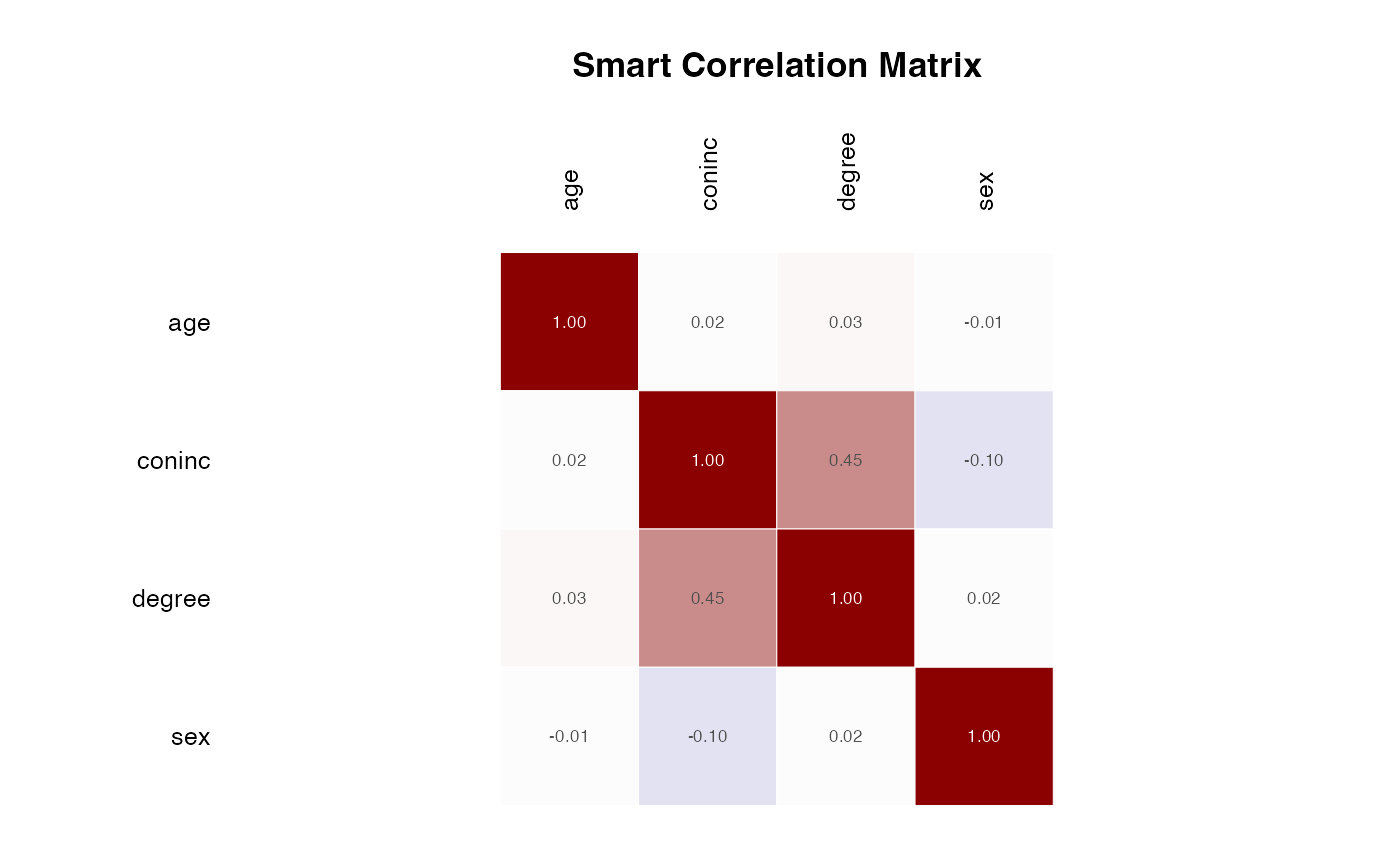
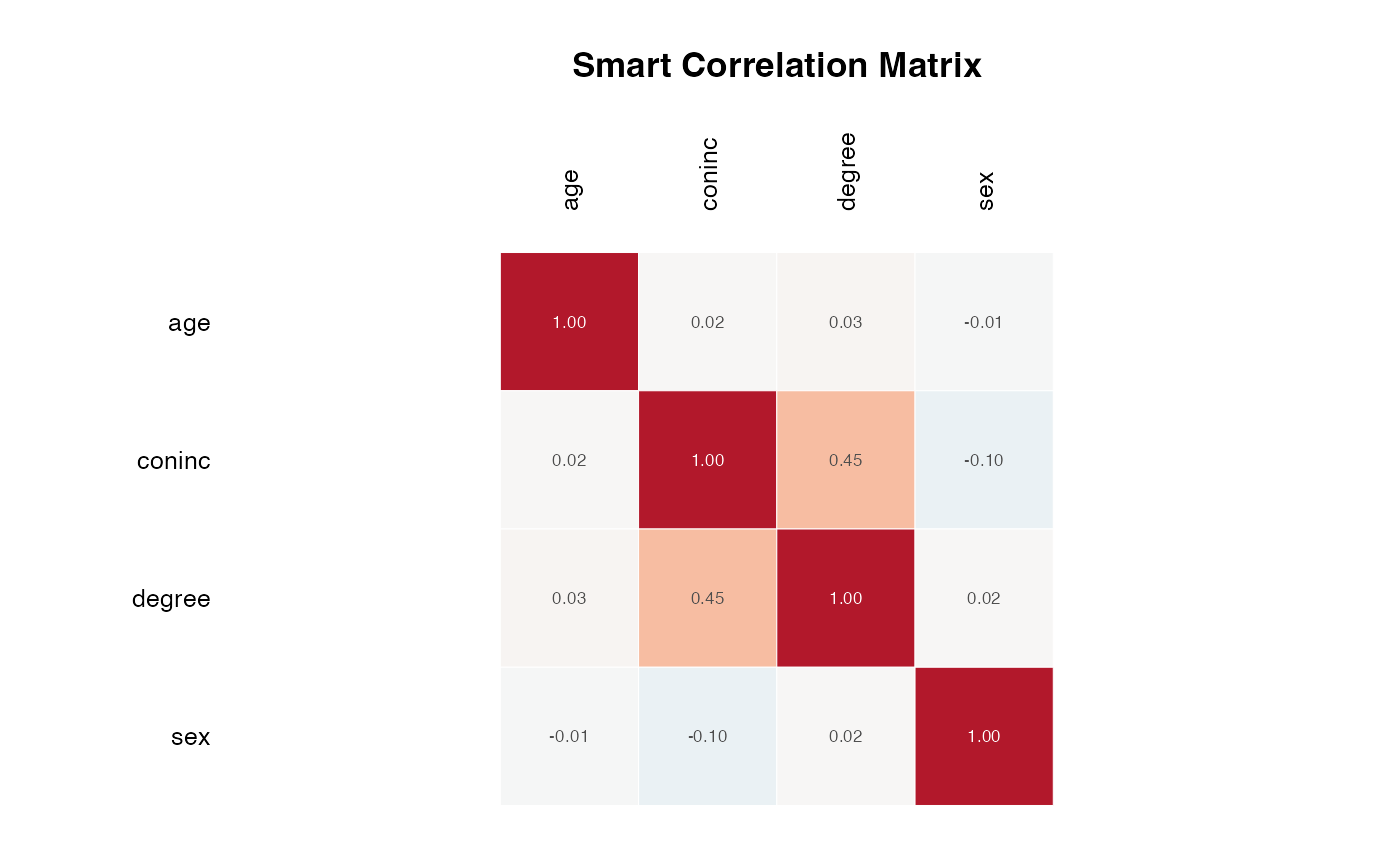
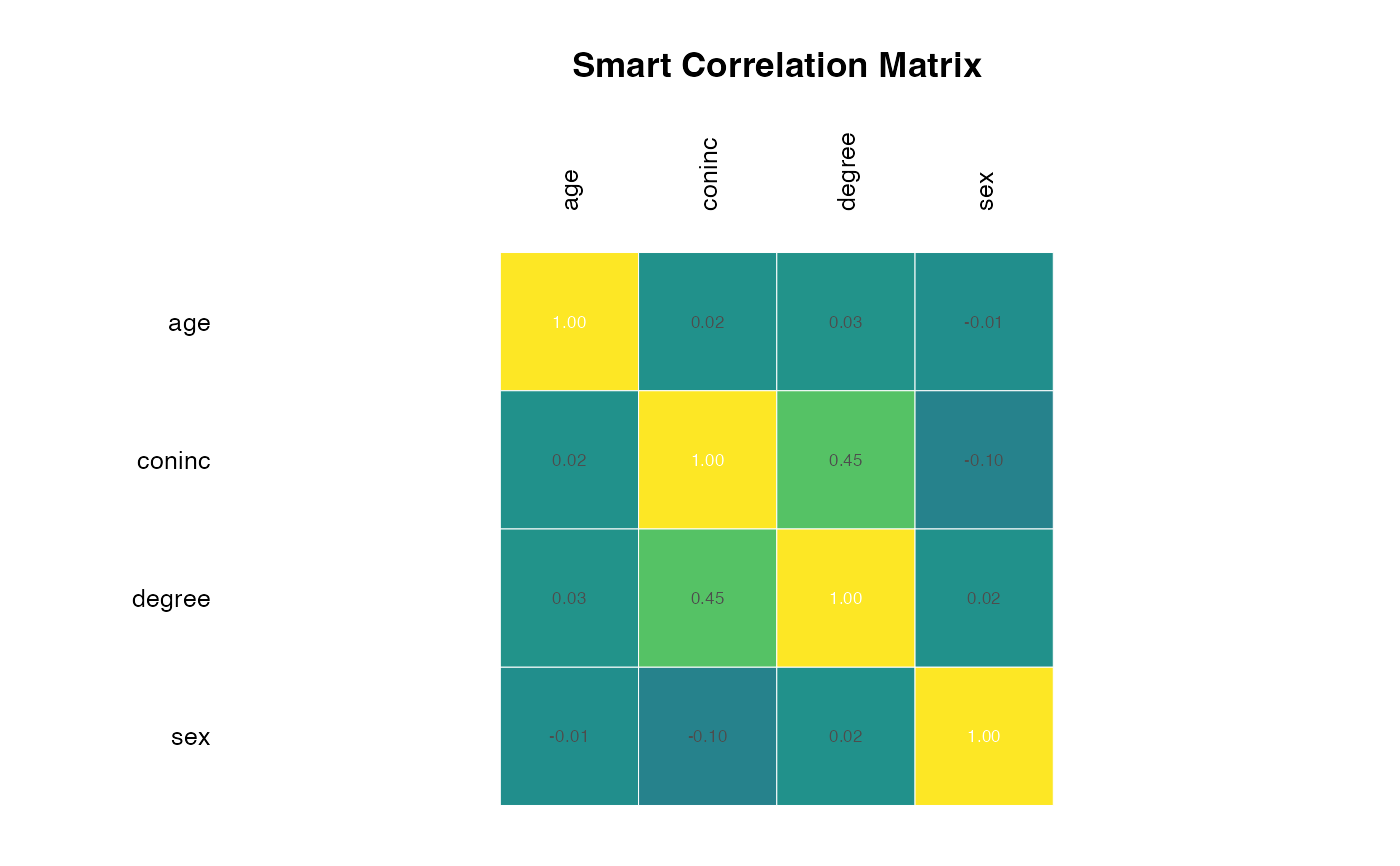
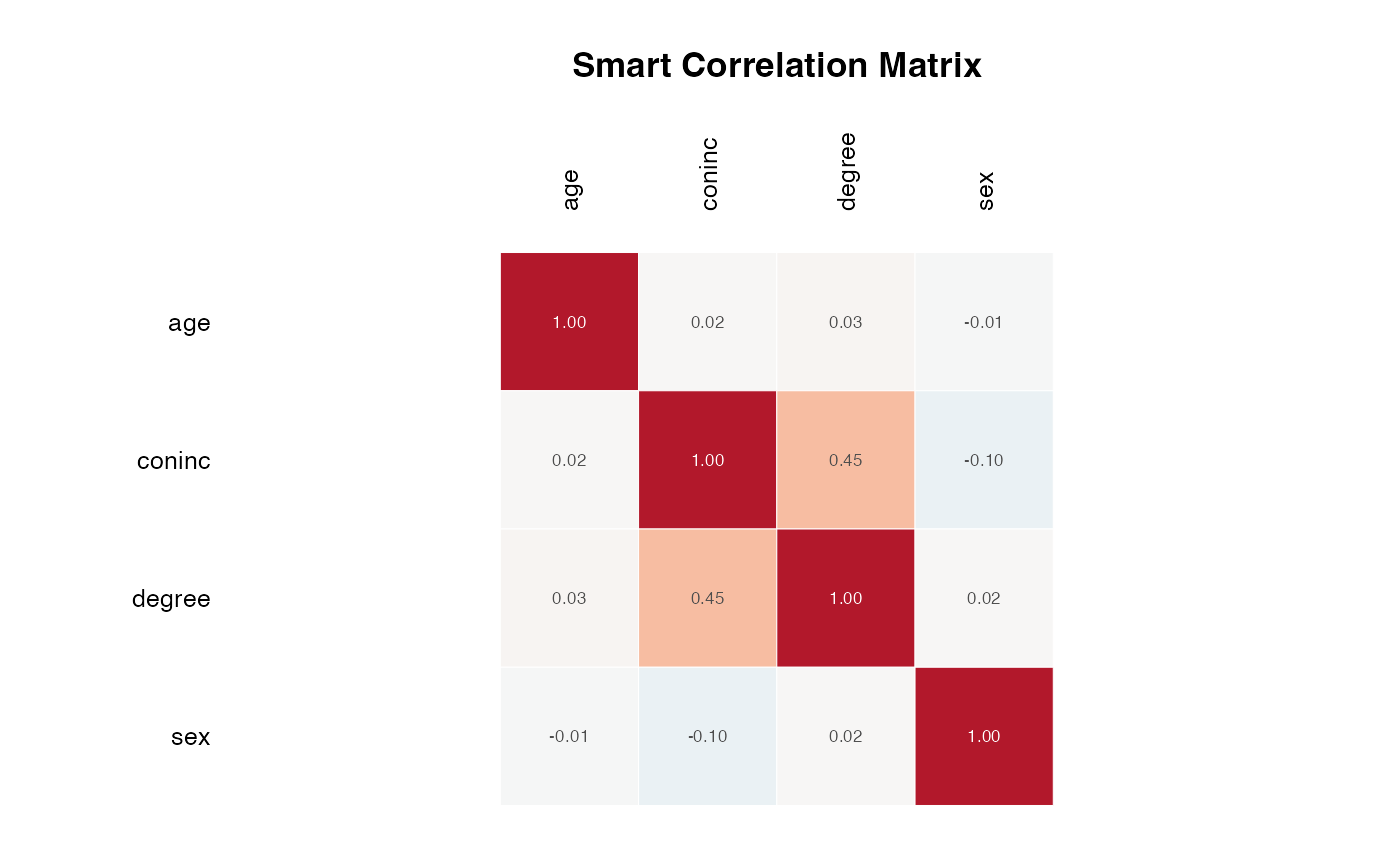
Draws an annotated heatmap of a smart correlation matrix with base R. Each cell is coloured by the correlation and labelled with its value.
Usage
# S3 method for class 'smartcormat'
plot(
  x,
  palette = "blue_red",
  digits = 2,
  title = NULL,
  show_values = TRUE,
  text_size = 1,
  ...
)

plot_cor_heatmap(
  x,
  palette = "blue_red",
  digits = 2,
  title = NULL,
  show_values = TRUE,
  text_size = 1,
  ...
)
Arguments
- x
A
smartcormatobject (fromsmart_cormat()), or a named list with acorrelationselement (e.g., fromsmart_cor_df()).- palette
Character string selecting the colour palette. One of:
"blue_red"(default): diverging blue-white-red"purple_green": diverging purple-white-green"viridis": sequential yellow-green-blue"heat": sequential white-yellow-red"cool": sequential white-cyan-blue
- digits
Integer. Number of decimal places shown in cell labels. Default:
2.- title
Optional character string for the plot title. If
NULL(default), a generic title is used.- show_values
Logical. Whether to display numeric values in each cell. Default:
TRUE.- text_size
Numeric. Scaling factor for cell text size. Default:
1.- ...
Additional arguments (currently ignored).
Details
The function works with any object that contains a correlations element
(matrix or data frame). This includes objects returned by smart_cormat()
and smart_cor_df().
Custom colour palettes can be supplied by passing a character vector of
colours to palette instead of a named preset. The vector should contain
at least 3 colours and will be interpolated to 100 steps.
Examples
csv = system.file("extdata", "gss_2024_casestudy.csv", package = "smartcor")
gss = read.csv(csv)
# Plot a smart_cormat result
mat = smart_cormat(
gss[, c("age", "coninc", "degree", "sex")],
assume_latent_normal = FALSE,
verbose = FALSE
)
plot(mat)
 # different palettes
plot(mat, palette = "purple_green")
# different palettes
plot(mat, palette = "purple_green")
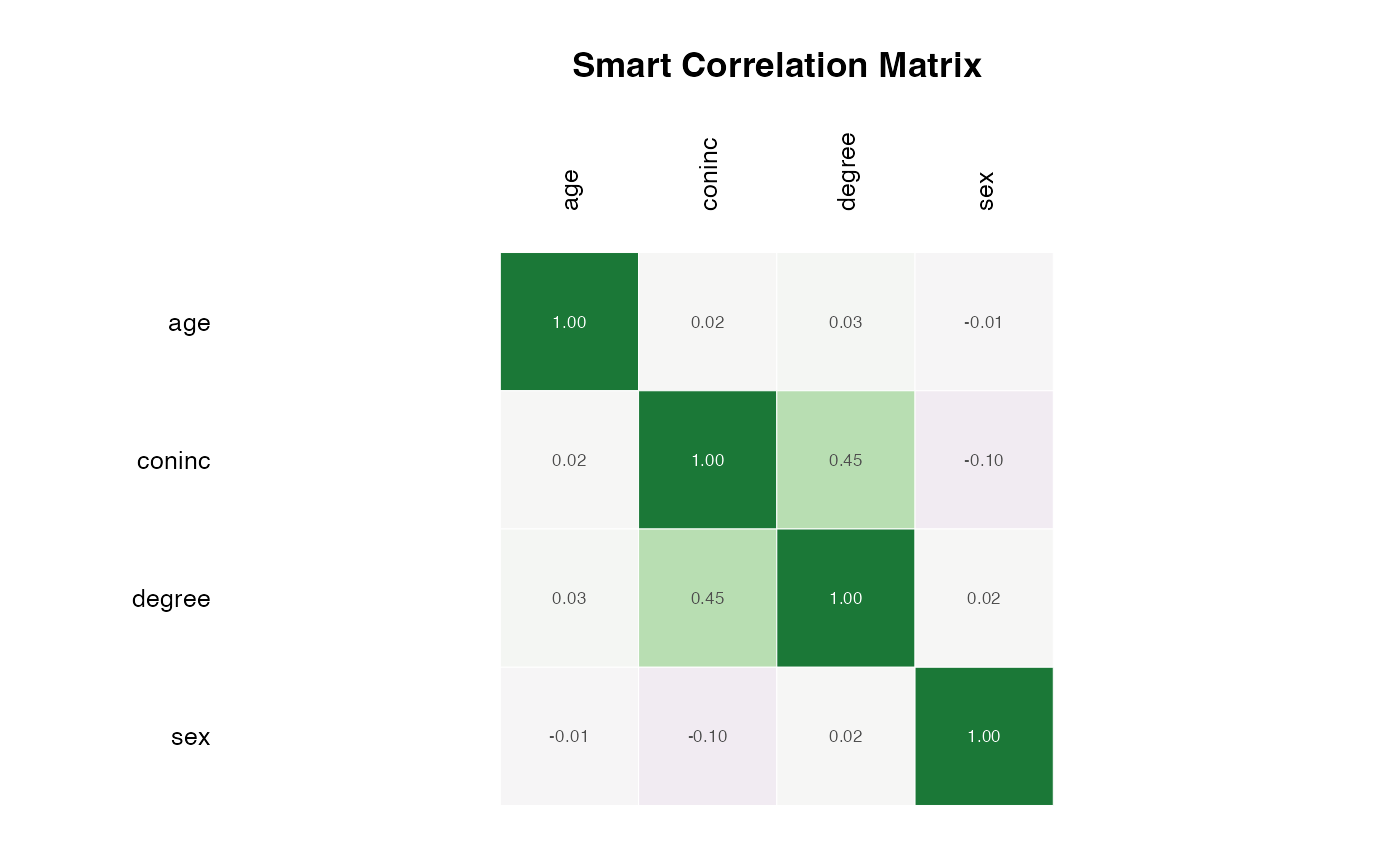 plot(mat, palette = "viridis")
 # Plot a smart_cor_df result
res = smart_cor_df(gss[, c("age", "coninc", "degree", "sex")],
assume_latent_normal = FALSE)
plot_cor_heatmap(res)
# Plot a smart_cor_df result
res = smart_cor_df(gss[, c("age", "coninc", "degree", "sex")],
assume_latent_normal = FALSE)
plot_cor_heatmap(res)
 # custom colour vector
plot_cor_heatmap(res, palette = c("darkblue", "white", "darkred"))
# custom colour vector
plot_cor_heatmap(res, palette = c("darkblue", "white", "darkred"))