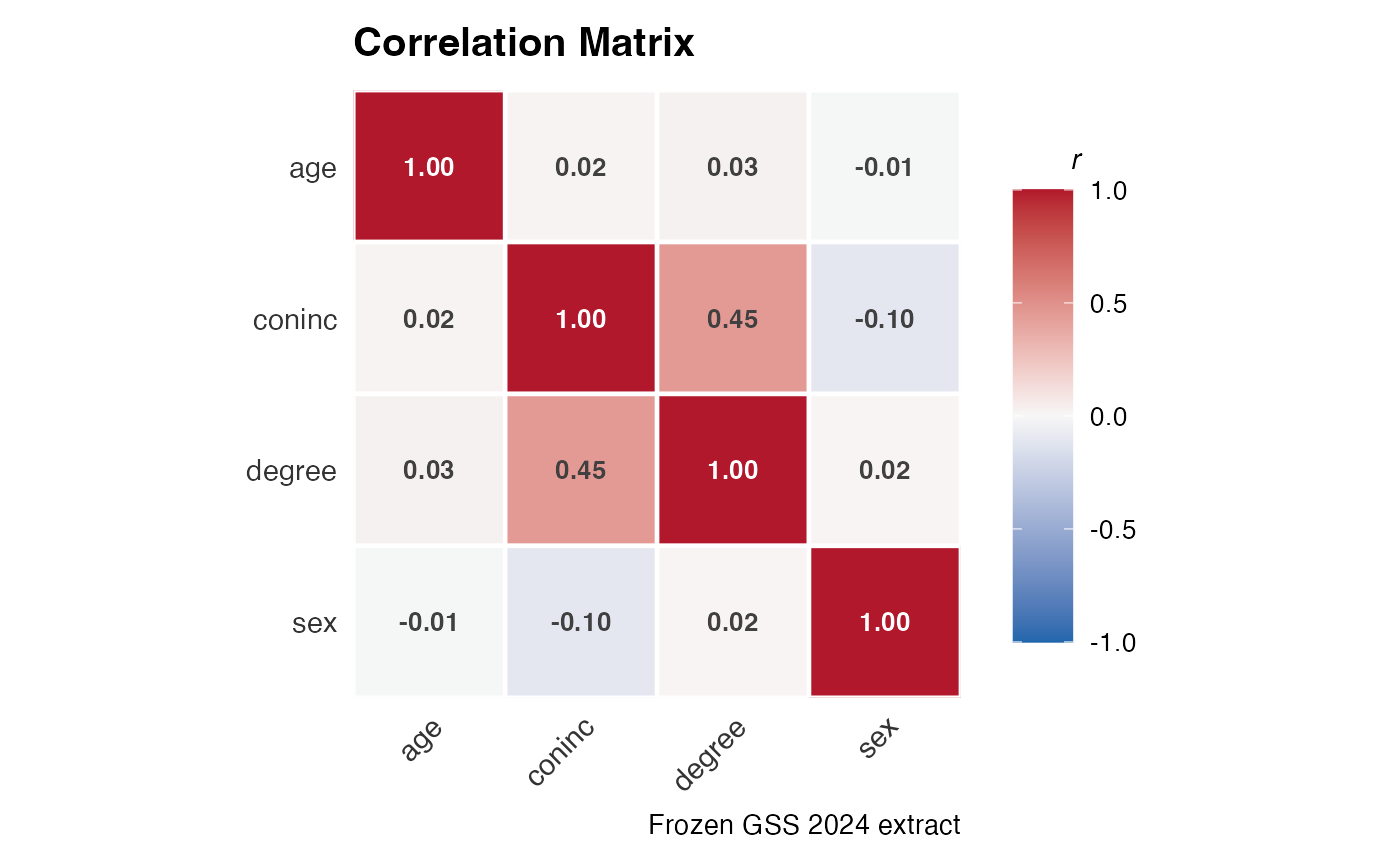
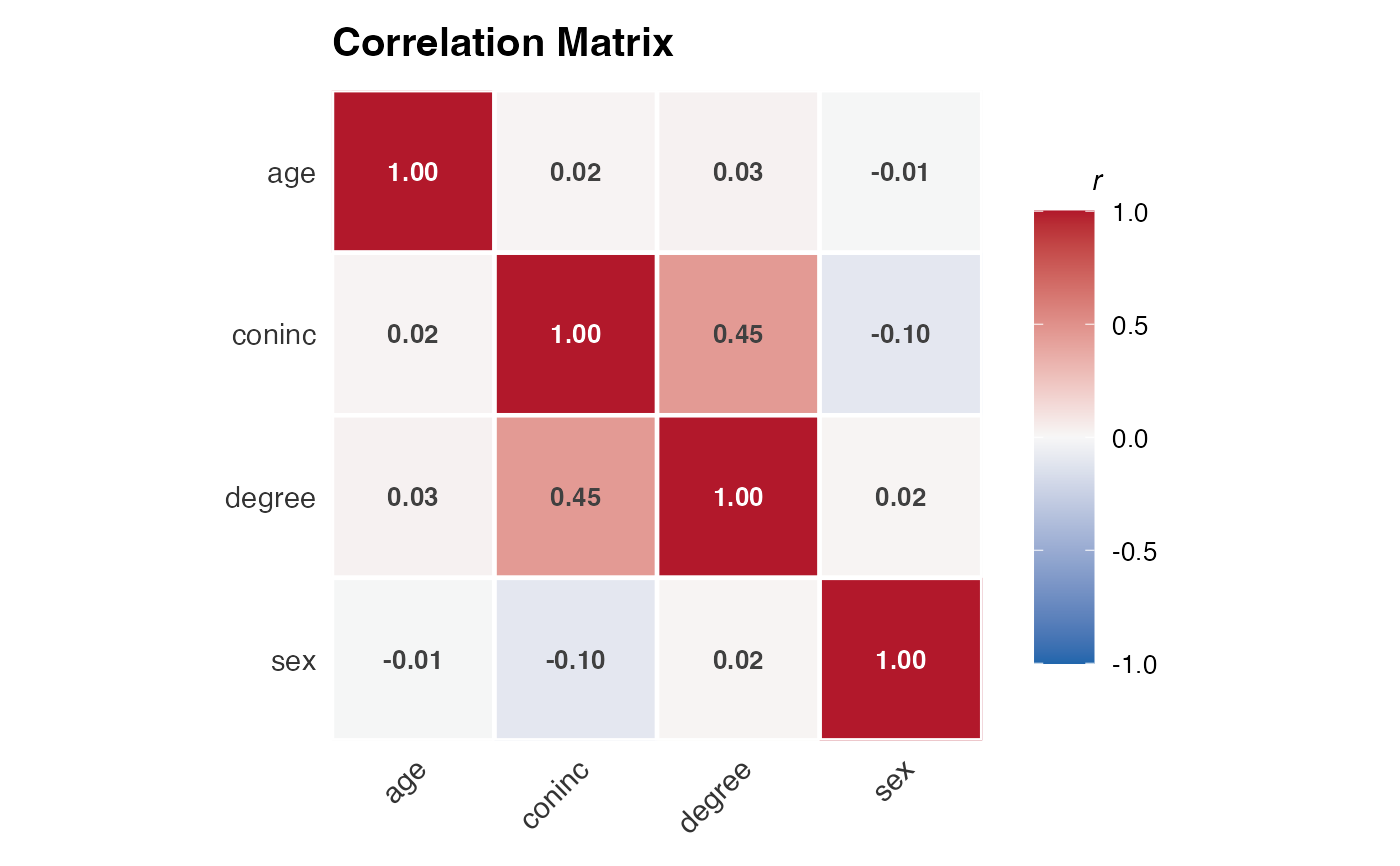
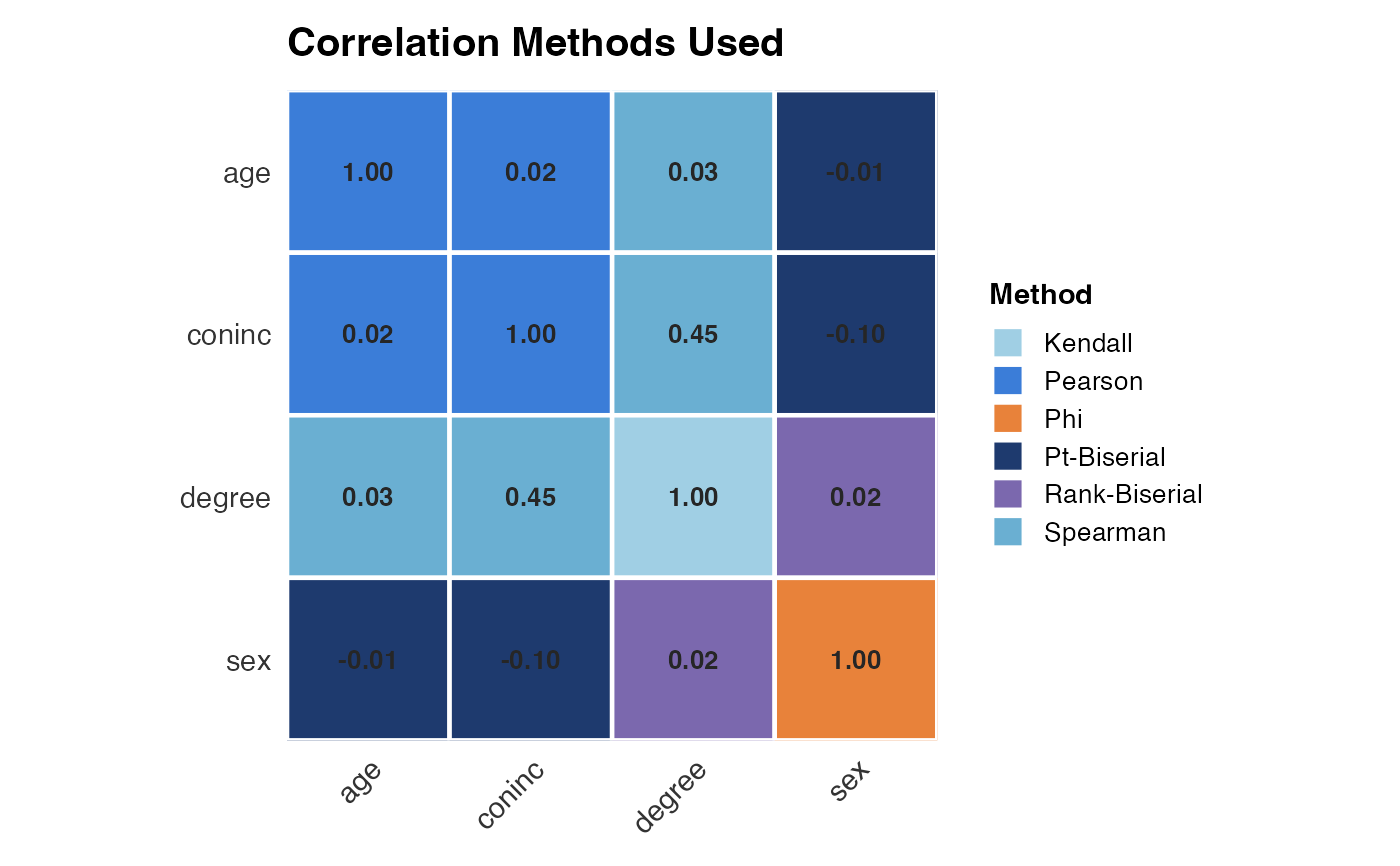
Two heatmaps for smart_cormat() output. ggcor_heatmap() shows the
correlation values on a diverging scale centred at zero.
ggcor_method_heatmap() colours each cell by the selected method.
Usage
ggcor_heatmap(
  x,
  palette = "blue_red",
  digits = 2,
  title = NULL,
  show_values = TRUE,
  text_size = 3.5,
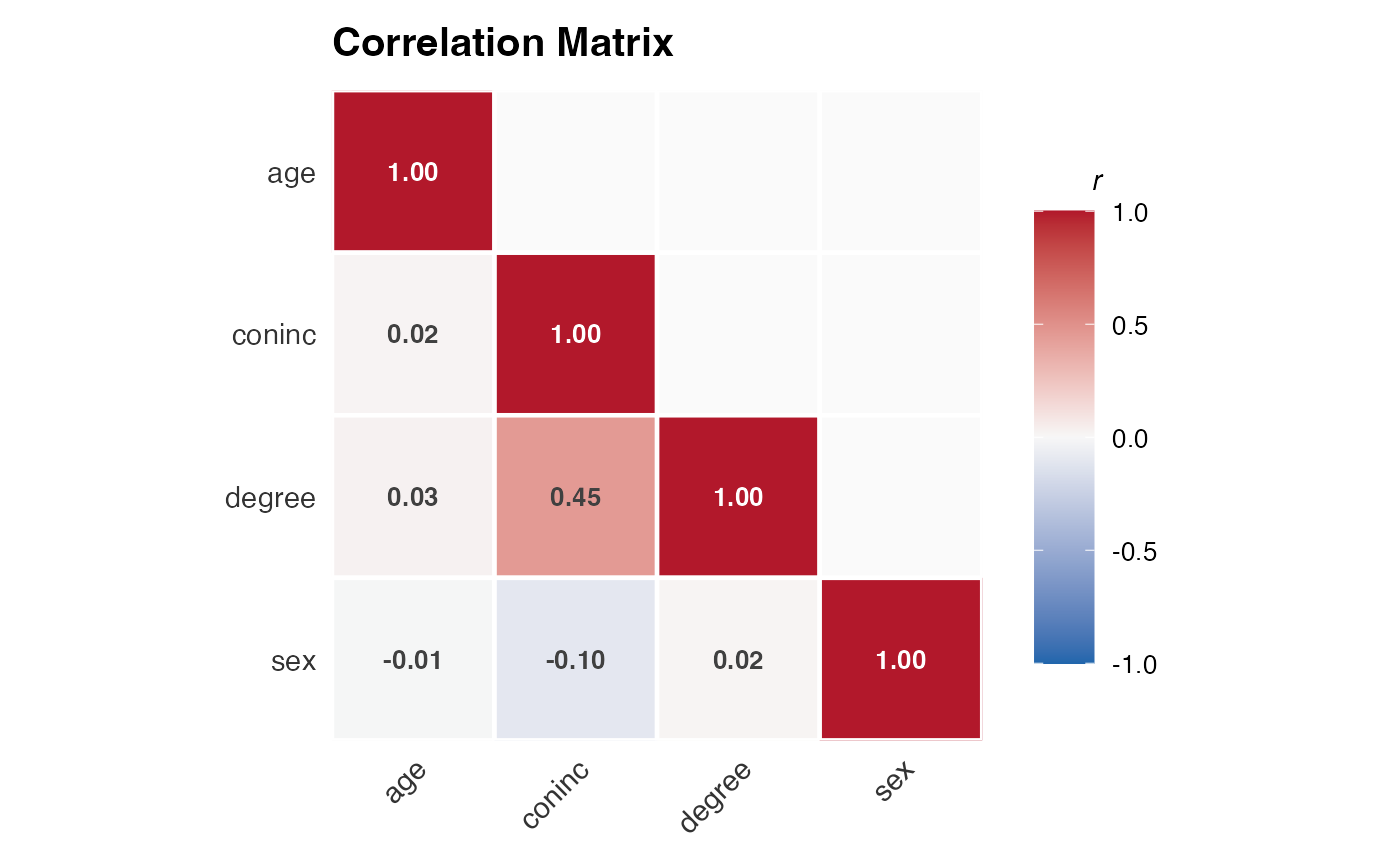
  lower_only = FALSE,
  ...
)

ggcor_method_heatmap(
  x,
  title = NULL,
  show_values = TRUE,
  text_size = 3.5,
  digits = 2,
  ...
)
Arguments
- x
A
smartcormatobject (fromsmart_cormat()), or a named list with acorrelationselement (e.g., fromsmart_cor_df()).- palette
Character string selecting the colour palette. For
ggcor_heatmap: one of"blue_red"(default),"purple_green", or a vector of 3 colours (low, mid, high).- digits
Integer. Number of decimal places in cell labels. Default:
2.- title
Optional plot title. If
NULL, a default is used.- show_values
Logical. Show correlation values in cells? Default:
TRUE.- text_size
Numeric. Base text size for cell labels. Default:
3.5.- lower_only
Logical. Show only the lower triangle? Default:
FALSE.- ...
Currently ignored.
Examples
csv = system.file("extdata", "gss_2024_casestudy.csv", package = "smartcor")
gss = read.csv(csv)
mat = smart_cormat(
gss[, c("age", "coninc", "degree", "sex")],
assume_latent_normal = FALSE,
verbose = FALSE
)
# correlation heatmap
ggcor_heatmap(mat)
 # lower triangle only
ggcor_heatmap(mat, lower_only = TRUE)
# lower triangle only
ggcor_heatmap(mat, lower_only = TRUE)
 # method-selection heatmap
ggcor_method_heatmap(mat)
# method-selection heatmap
ggcor_method_heatmap(mat)
 # customise further with ggplot2
ggcor_heatmap(mat) + ggplot2::labs(caption = "Frozen GSS 2024 extract")
# customise further with ggplot2
ggcor_heatmap(mat) + ggplot2::labs(caption = "Frozen GSS 2024 extract")